Vue d'ensemble des paramètres du plan
Un plan de tout ce que vous pouvez gérer après la création d'un plan : Paramètres du plan, Gestion des sièges, Gestion des RSVP, collaborateurs et invitations par e-mail.
Une fois qu'un plan existe, tout ce que vous avez configuré dans l'assistant, et bien plus encore, se trouve au même endroit : les paramètres du plan. Cet article est un plan de ce qui s'y trouve, pour que vous sachiez où aller.
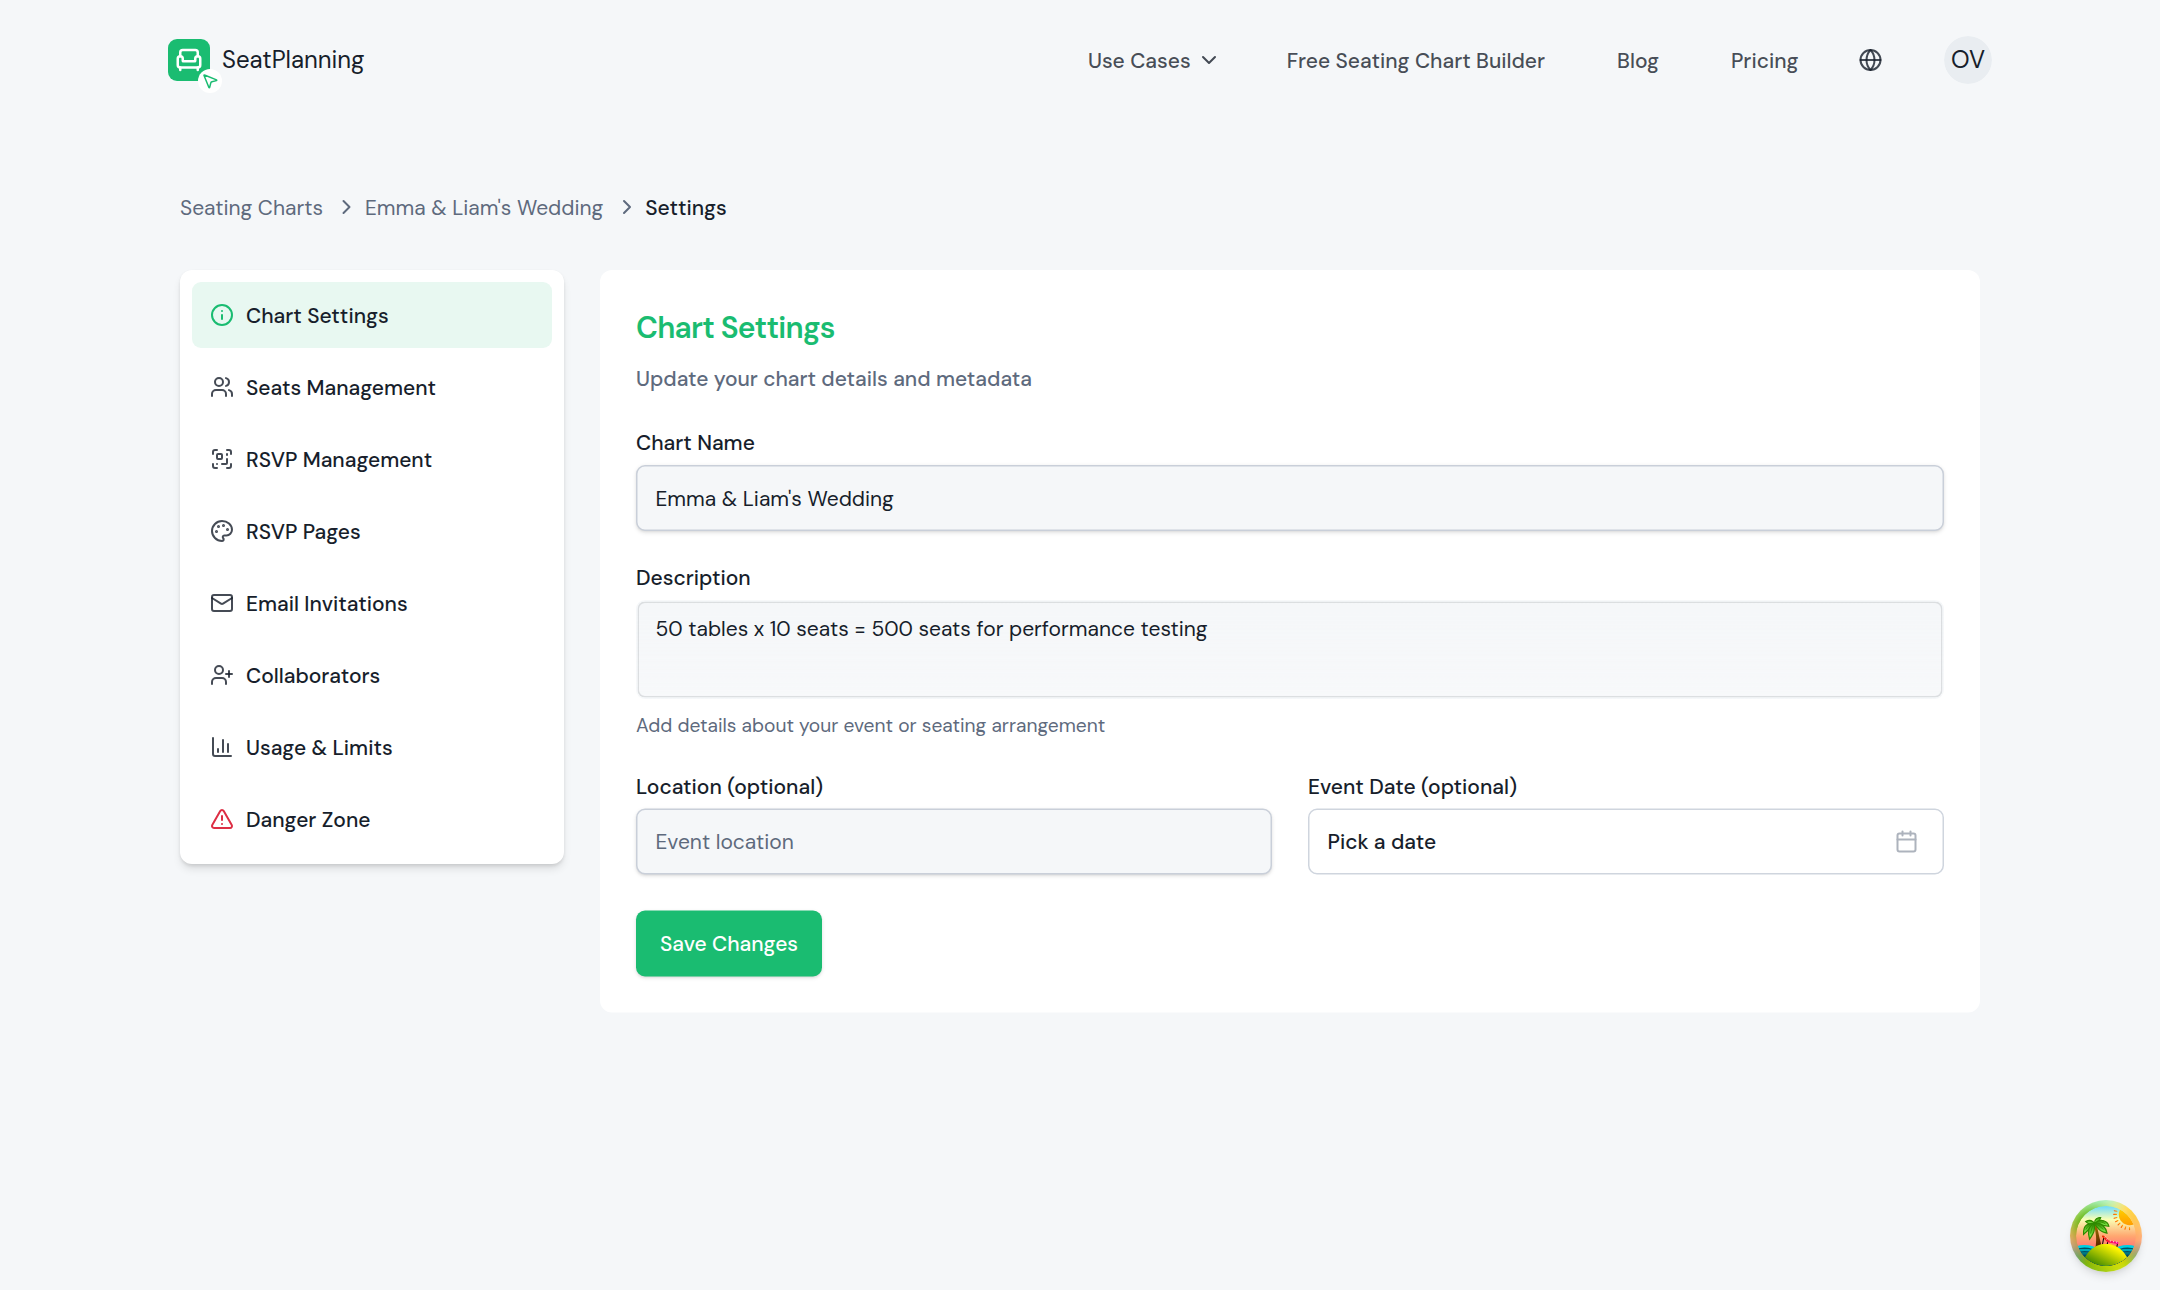
- 1Passez d'une section à l'autre : informations du plan, sièges, RSVP, collaborateurs, et plus.
- 2Modifiez le nom, la description, le lieu et la date de votre événement.
Paramètres du plan
C'est ici que se trouvent le nom, la description, la date et le lieu de votre événement après l'assistant. Modifiez-les à tout moment : les changements se répercutent sur votre page RSVP publique si vous en avez une. C'est aussi ici que vous pouvez activer la Vue publique, un lien en lecture seule que n'importe qui peut ouvrir sans se connecter (vous pouvez aussi l'activer, et ajouter un mot de passe, depuis le bouton Partager de la barre d'outils du canevas). Consultez Partager un plan en lecture seule (vue publique) pour les détails.
Gestion des sièges
Gestion des sièges s'ouvre sur votre liste d'invités, avec le statut RSVP et de réclamation de chaque invité. Un second onglet, Configuration des sièges, permet de définir si le nom de famille, l'e-mail et le téléphone sont obligatoires, et d'ajouter vos propres questions personnalisées. C'est la même configuration que dans Choisir les informations à collecter sur vos invités, et vous pouvez l'ajuster à tout moment, même après que des invités ont déjà été placés.
Gestion des RSVP
Cette section vous permet de choisir votre mode RSVP, de voir les réponses arriver et de consulter les analyses de réponses. Elle comporte trois onglets : Tableau de bord pour la liste des invités et les réponses, Analyses pour les taux de réponse, et Configuration RSVP pour basculer entre les modes Manuel, RSVP en libre-service et Billet numérique & entrée QR. Si vous n'avez pas encore configuré cela, commencez par Choisir un mode RSVP.
Pages RSVP
Une section distincte vous permet de personnaliser la page publique que voient vos invités quand ils répondent au RSVP ou consultent le plan : couleurs, polices et logo, pour qu'elle corresponde à votre événement.
Invitations par e-mail
Si votre forfait le permet, c'est ici que vous envoyez des e-mails d'invitation aux invités déjà présents sur votre liste et choisissez un modèle pour eux. Vous ne pouvez envoyer un e-mail qu'aux invités déjà dans votre liste, pas à des adresses arbitraires.
Collaborateurs
Invitez d'autres personnes à vous aider à construire le plan. Seul le propriétaire du plan peut envoyer des invitations, et le rôle de chaque collaborateur détermine ce qu'il peut faire, par exemple s'il peut modifier le canevas ou seulement le consulter.
Utilisation et limites et la Zone de danger
Utilisation et limites montre combien de la capacité de votre forfait vous utilisez, comme les tables, les sièges et les collaborateurs. Une section distincte, Zone de danger, contient des actions irréversibles, vider le canevas ou supprimer le plan, et seul le propriétaire peut les utiliser.
Qui peut changer quoi
Le propriétaire du plan peut tout modifier : informations du plan, champs invités obligatoires, champs personnalisés, collaborateurs et actions destructrices dans la Zone de danger. Les collaborateurs peuvent agir dans les limites que leur rôle autorise, en général ajouter et organiser sièges et éléments, mais les paramètres au niveau du plan restent réservés au propriétaire. Si un paramètre vous semble grisé, c'est pour cette raison.
Et ensuite
- Définir le nom, la date et le lieu de votre événement pour la première section que vous utiliserez probablement.
- Choisir les informations à collecter sur vos invités pour affiner ce que vous demandez à vos invités.
- Partager un plan en lecture seule (vue publique) pour permettre à d'autres de voir le plan sans compte.